
B300 NVFP4 Inference: First Independent Single-Node Benchmarks

12,518 tok/s on DeepSeek R1. A silent 27% uplift from driver 595. And why Expert Parallelism isn’t ready for production.
1. The Setup
B300 shipments have been ramping since Q3 2025, but public single-node inference numbers on open-source models have been scarce. NVIDIA’s marketing slides show GB200 NVL72 rack-scale numbers. Cloud providers quote H200 baselines. What nobody has published — until now — is what a single air-cooled B300 NVL8 node actually delivers on the models people are deploying today, at the precision that makes Blackwell worth buying.
We ran a comprehensive inference benchmark across five Tier S open-weight models on a single B300 NVL8 node: 8× B300 SXM6 AC GPUs, 288 GB HBM3e each, 2,304 GB total VRAM. Air-cooled. Driver 595.58.03, CUDA 13.2. All models quantized to NVFP4 using NVIDIA Model Optimizer — the 4-bit format native to Blackwell’s Tensor Cores. Served via SGLang with TP=8 across all GPUs.
NVFP4 is the Blackwell differentiator. It cuts memory footprint roughly 4× versus FP16 with minimal accuracy degradation, enabling single-node deployment of models that previously required multi-node setups. A 671B-parameter DeepSeek R1 compresses to approximately 400 GB in NVFP4 — comfortably within one B300 node’s 2.3 TB. This changes the deployment economics fundamentally.
Hardware spec:
ComponentSpecificationGPU8× NVIDIA B300 SXM6 ACHBM3e per GPU288 GBTotal VRAM2,304 GBMemory bandwidth8 TB/s per GPUNVLink 51.8 TB/s per GPUTDP1,100W per GPU (8,800W node)CoolingAir-cooledCompute capabilitySM 103aDriver595.58.03CUDA13.2
2. The Numbers
All benchmarks used random synthetic data with the following methodology, aligned with SemiAnalysis InferenceX standards: three sequence length profiles (1k1k balanced, 1k4k decode-heavy, 4k1k prefill-heavy), concurrency swept from 1 to 256 until failures or throughput plateau, TP=8 across all GPUs, NVFP4 precision, SGLang serving framework.
One-line per model:
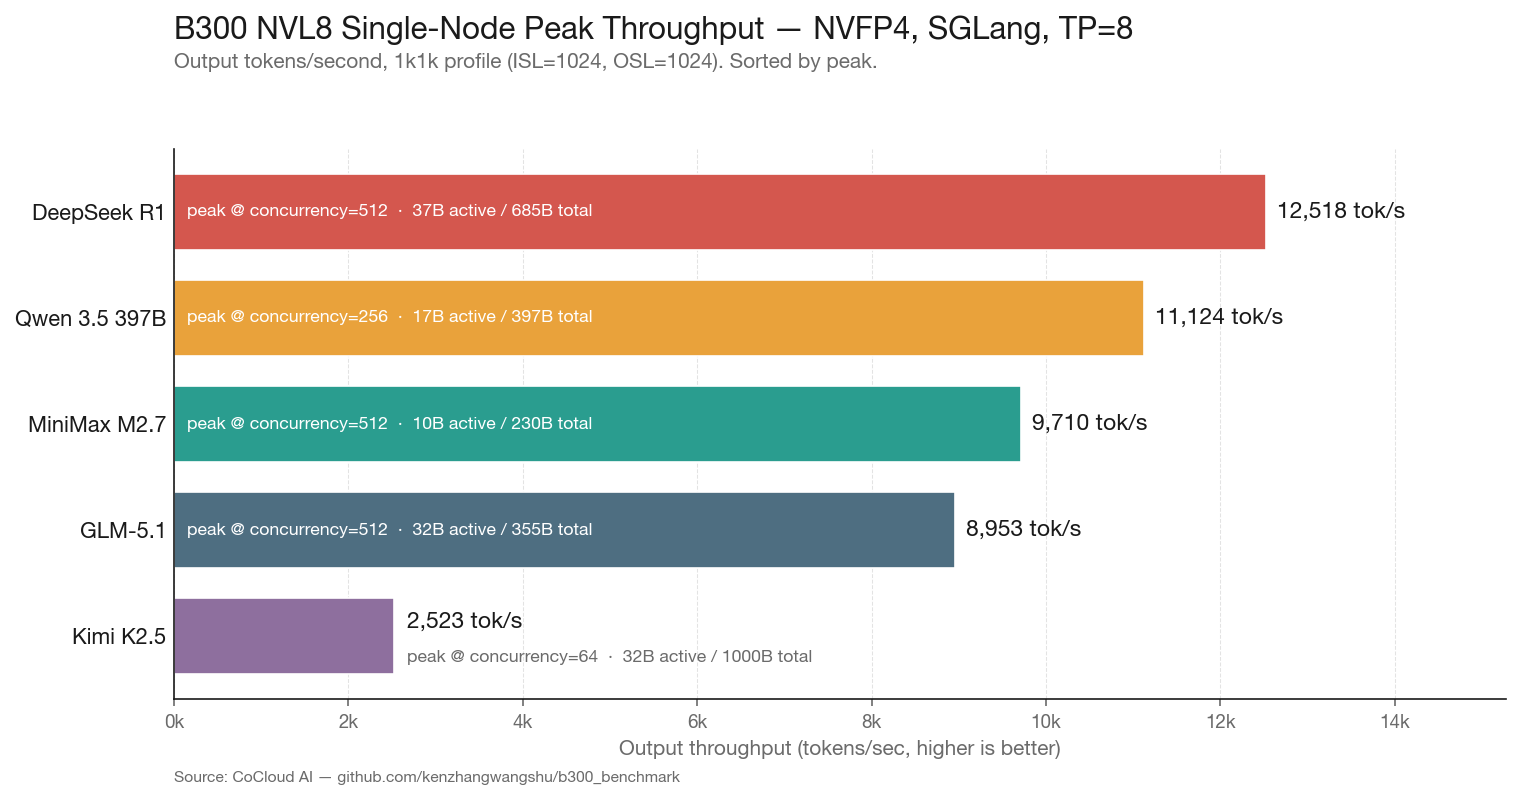
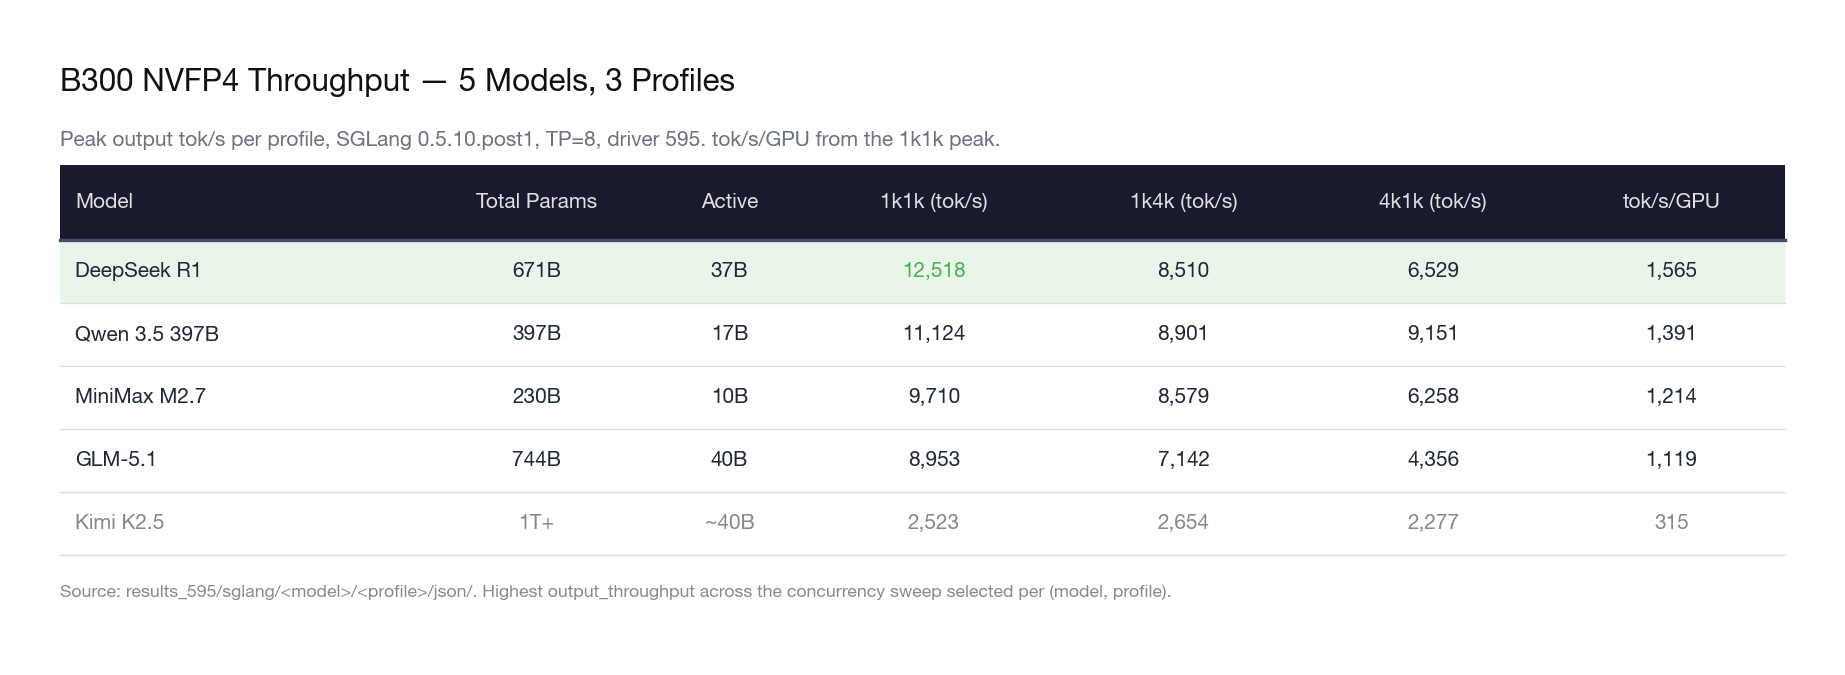
DeepSeek R1 dominates dense decode throughput. At 12,518 tok/s on 1k1k, it leads the field by 12.5%. The MLA (Multi-head Latent Attention) architecture compresses KV cache aggressively, leaving more VRAM for batching. This is the model that benefits most from Blackwell’s memory bandwidth.
Qwen 3.5 397B is the most consistent performer across all profiles. The gap between its best (11,124 on 1k1k) and worst (8,901 on 1k4k) is only 20%. On the prefill-heavy 4k1k profile, Qwen leads by 40% over DeepSeek R1 (9,151 vs 6,529). If you are building a RAG pipeline, Qwen is your model.
MiniMax M2.7 punches above its weight class. With only 10B active parameters — the smallest in the lineup — it still delivers 9,710 tok/s. The economic implications are staggering (more on this in Section 5).
GLM-5.1 carries 744B total parameters and holds its own at 8,953 tok/s. Notably, this model was trained entirely on Huawei Ascend chips. The inference numbers on Blackwell show no architectural penalty from the training platform choice.
Kimi K2.5 is the outlier. At 2,523 tok/s, it runs at roughly one-quarter the throughput of the other models. The primary bottleneck appears to be a Python-based tokenizer (no Rust fast tokenizer available) combined with the sheer parameter count exceeding 1 trillion. The slow tokenizer inflates TTFT at every concurrency level, creating a throughput ceiling that compute optimization cannot break through.
3. Scaling Behavior
The headline numbers tell you the peak. The scaling curves tell you where to operate.
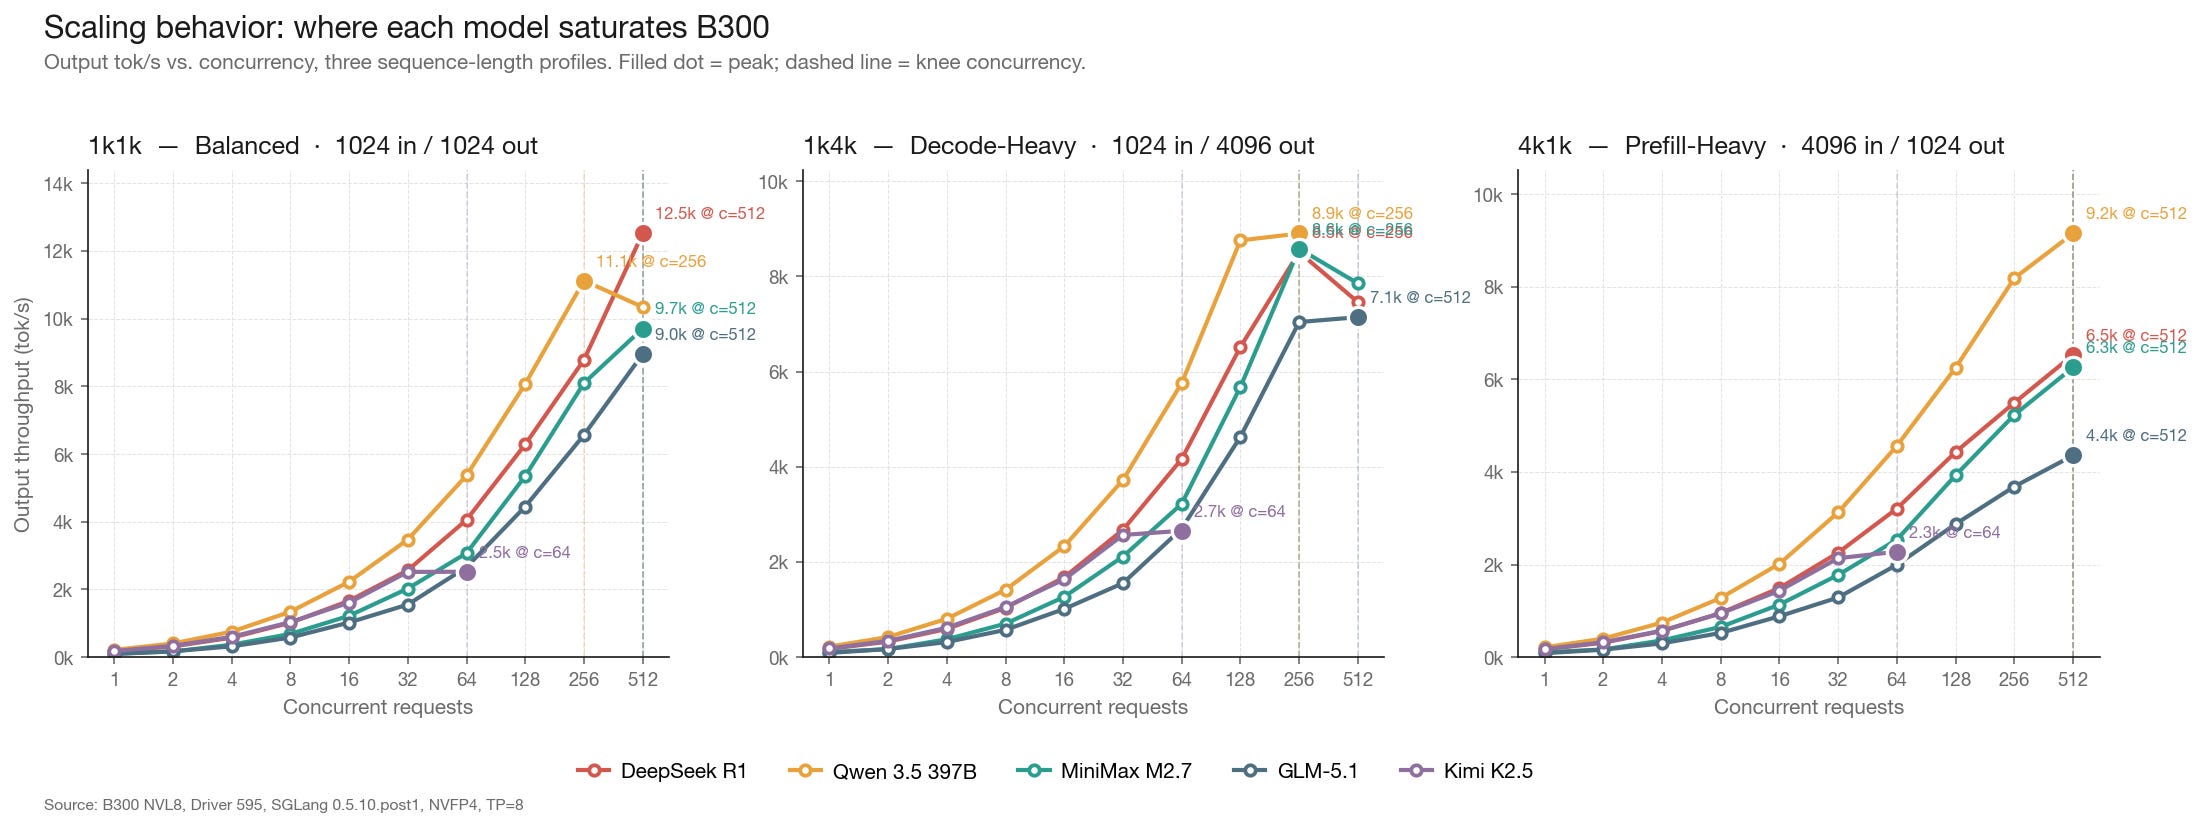
1k1k (balanced): Most models scale linearly up to concurrency 32–64, then plateau. DeepSeek R1 and Qwen 3.5 maintain near-linear scaling the longest, reaching peak throughput around concurrency 64–128. Kimi K2.5 flattens by concurrency 16.
1k4k (decode-heavy): The long output length (4,096 tokens per request) consumes significantly more KV cache per concurrent request. Peak concurrency drops to roughly half of the 1k1k ceiling across all models. Qwen 3.5 handles this profile the most gracefully, maintaining 8,901 tok/s — only a 20% decline from its 1k1k peak.
4k1k (prefill-heavy): Long input sequences stress the prefill computation. DeepSeek R1 drops 48% from its 1k1k peak (12,518 → 6,529), while Qwen 3.5 drops only 18% (11,124 → 9,151). The difference is architectural: Qwen’s attention mechanism handles long prefills more efficiently than DeepSeek’s MLA under sustained load.
The memory-bandwidth transition: At low concurrency, all models are compute-bound — the GPU cores are doing real work but not fully utilized. As concurrency increases, the workload transitions to memory-bandwidth-bound: the bottleneck shifts to moving KV cache and expert weights through HBM. The transition happens earlier for larger models (GLM-5.1 at ~concurrency 32) and later for smaller ones (M2.7 at ~concurrency 64). This is why HBM3e bandwidth (8 TB/s per GPU on B300) matters more than raw FLOPS for MoE inference.
4. The Silent 27% Uplift: What Changed in Driver 595
We have a dataset that nobody else publishes: the same node, same models, same framework, across two driver versions. Our initial benchmarks ran on driver 590.48.01 (CUDA 13.1). Mid-cycle, the node was upgraded to driver 595.58.03 (CUDA 13.2). We re-ran the full benchmark suite.
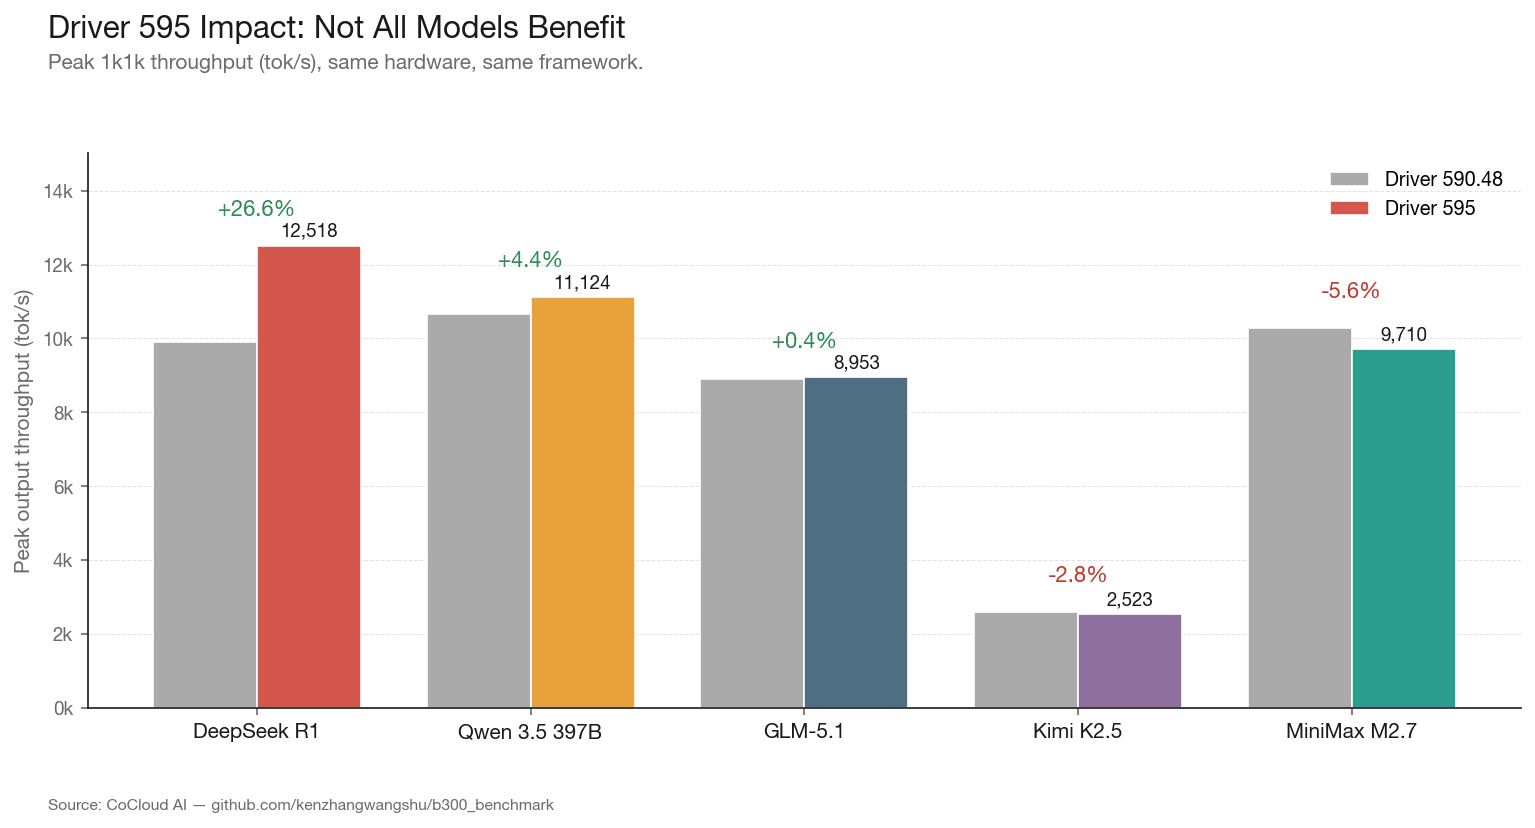
ModelDriver 590 (tok/s)Driver 595 (tok/s)DeltaDeepSeek R19,89112,518+26.6%Qwen 3.5 397B10,65211,124+4.4%GLM-5.18,9138,953+0.4%MiniMax M2.710,2849,710-5.6%Kimi K2.52,5952,523-2.8%
The result is striking: a 27% throughput increase for DeepSeek R1 from a driver update alone. No hardware change. No framework change. No model change. Just a driver binary.
We do not know the specific kernel changes in 595 that produced this. We reached out to NVIDIA; they did not provide details on specific kernel optimizations. What we can observe: the uplift is concentrated on the DeepSeek architecture. GLM-5.1, which uses DeepSeek Sparse Attention (DSA) but with a different overall architecture, saw no meaningful improvement. MiniMax M2.7 and Kimi K2.5 actually regressed slightly.
This has implications for anyone planning production deployments. Driver versions are not neutral. They are targeted optimizations, and the target can change between releases. If you are running DeepSeek models, driver 595 is a free 27% performance upgrade. If you are running MiniMax M2.7, driver 595 makes you marginally slower than 590. The standard advice to “always upgrade your driver” is not always correct.
For infrastructure operators, this means driver version should be pinned per model in production, not globally upgraded across a fleet.
5. Cost Analysis: The Token Factory Economics
The throughput numbers are interesting. The economics are actionable.
We modeled cost per million output tokens at peak concurrency for each model, using two GPU hourly rates: $4.10/GPU-hr (estimated bare-metal contract pricing for B300) and $6.50/GPU-hr (estimated cloud premium). Adjust to your own contract rate.
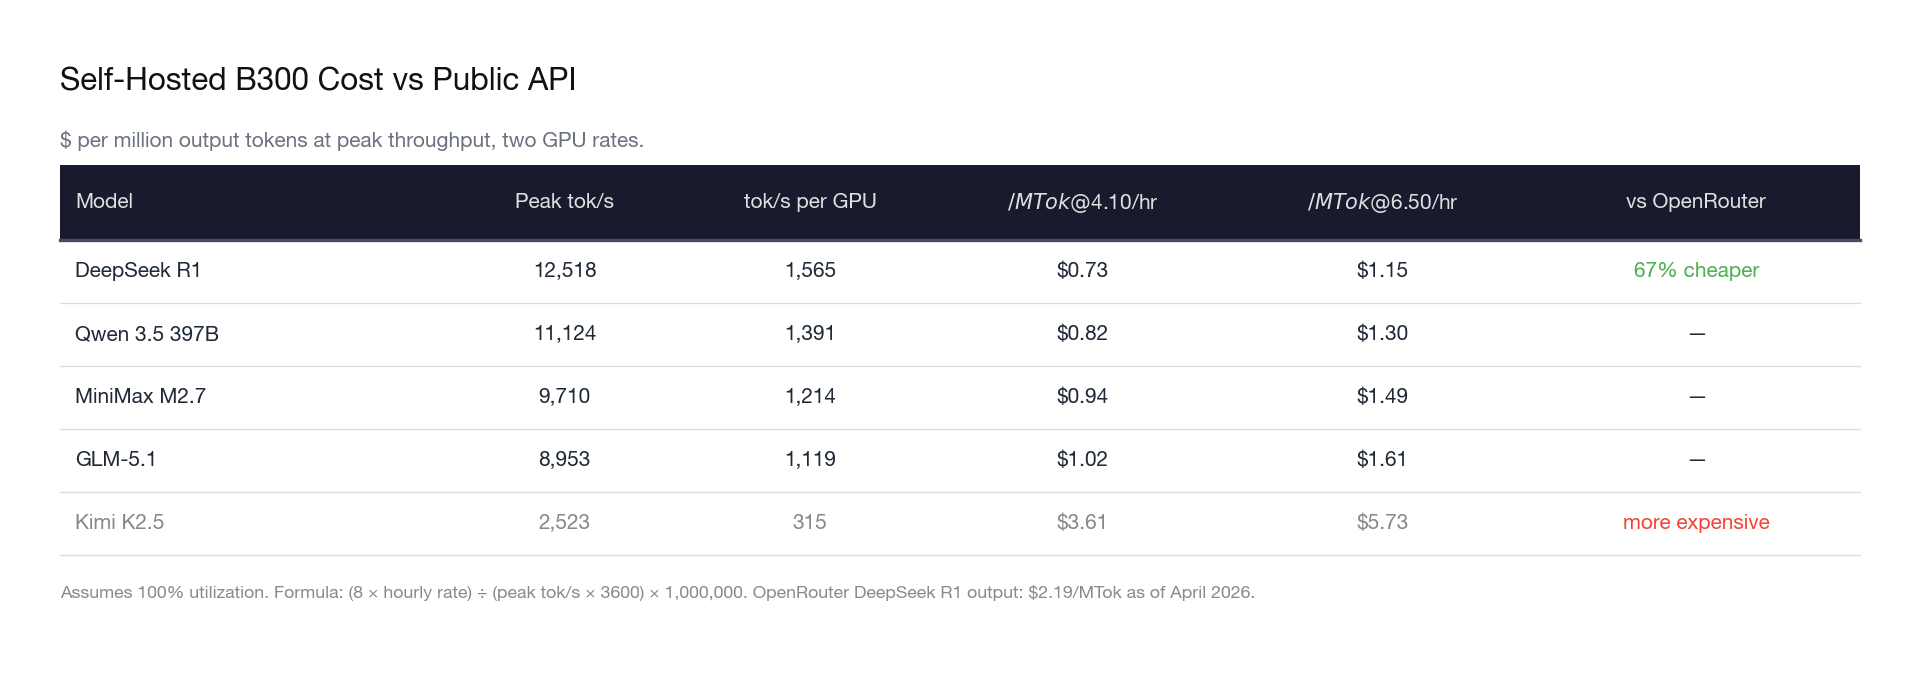
For context: OpenRouter currently prices DeepSeek R1 output at $2.19 per million tokens. At $0.73/MTok self-hosted on B300, the margin is 67%. At sustained 80% utilization, a single 8×B300 node generates roughly $180K/month in gross profit on DeepSeek R1 alone.
The MoE horizontal scaling insight: MiniMax M2.7 has only 10B active parameters. In NVFP4, the entire model fits in 115 GB — less than half of one B300’s 288 GB VRAM. This means you can run a complete model replica on a single GPU, not 8. On a 768-GPU cluster (96 nodes × 8 GPUs), that yields 768 independent replicas instead of 96 replicas at TP=8.
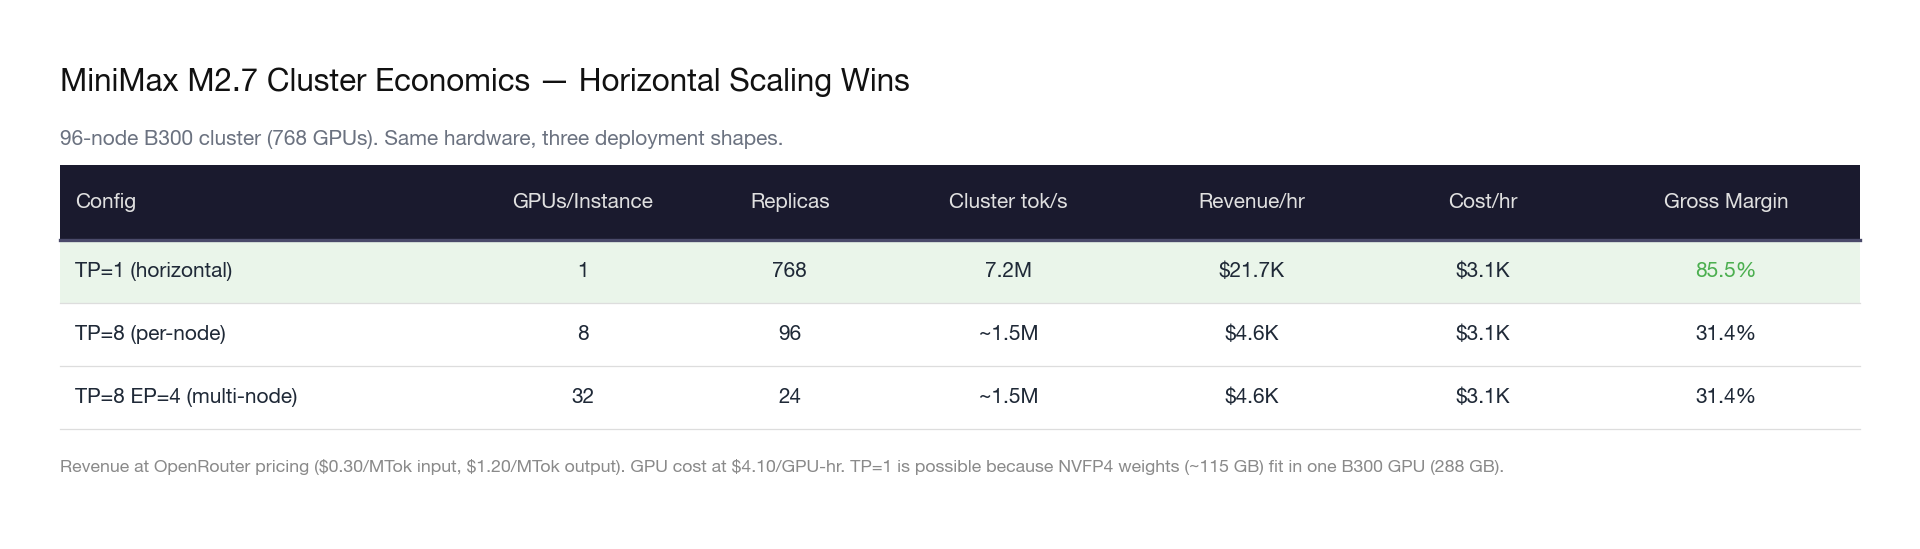
Same hardware. Same cost. Revenue increases 4.7×. The insight: for MoE models with small active parameters, the optimal deployment strategy is not deeper parallelism — it is more copies. The GPU fleet becomes a token factory where each GPU is an independent production line.
6. Engineering Disclosures
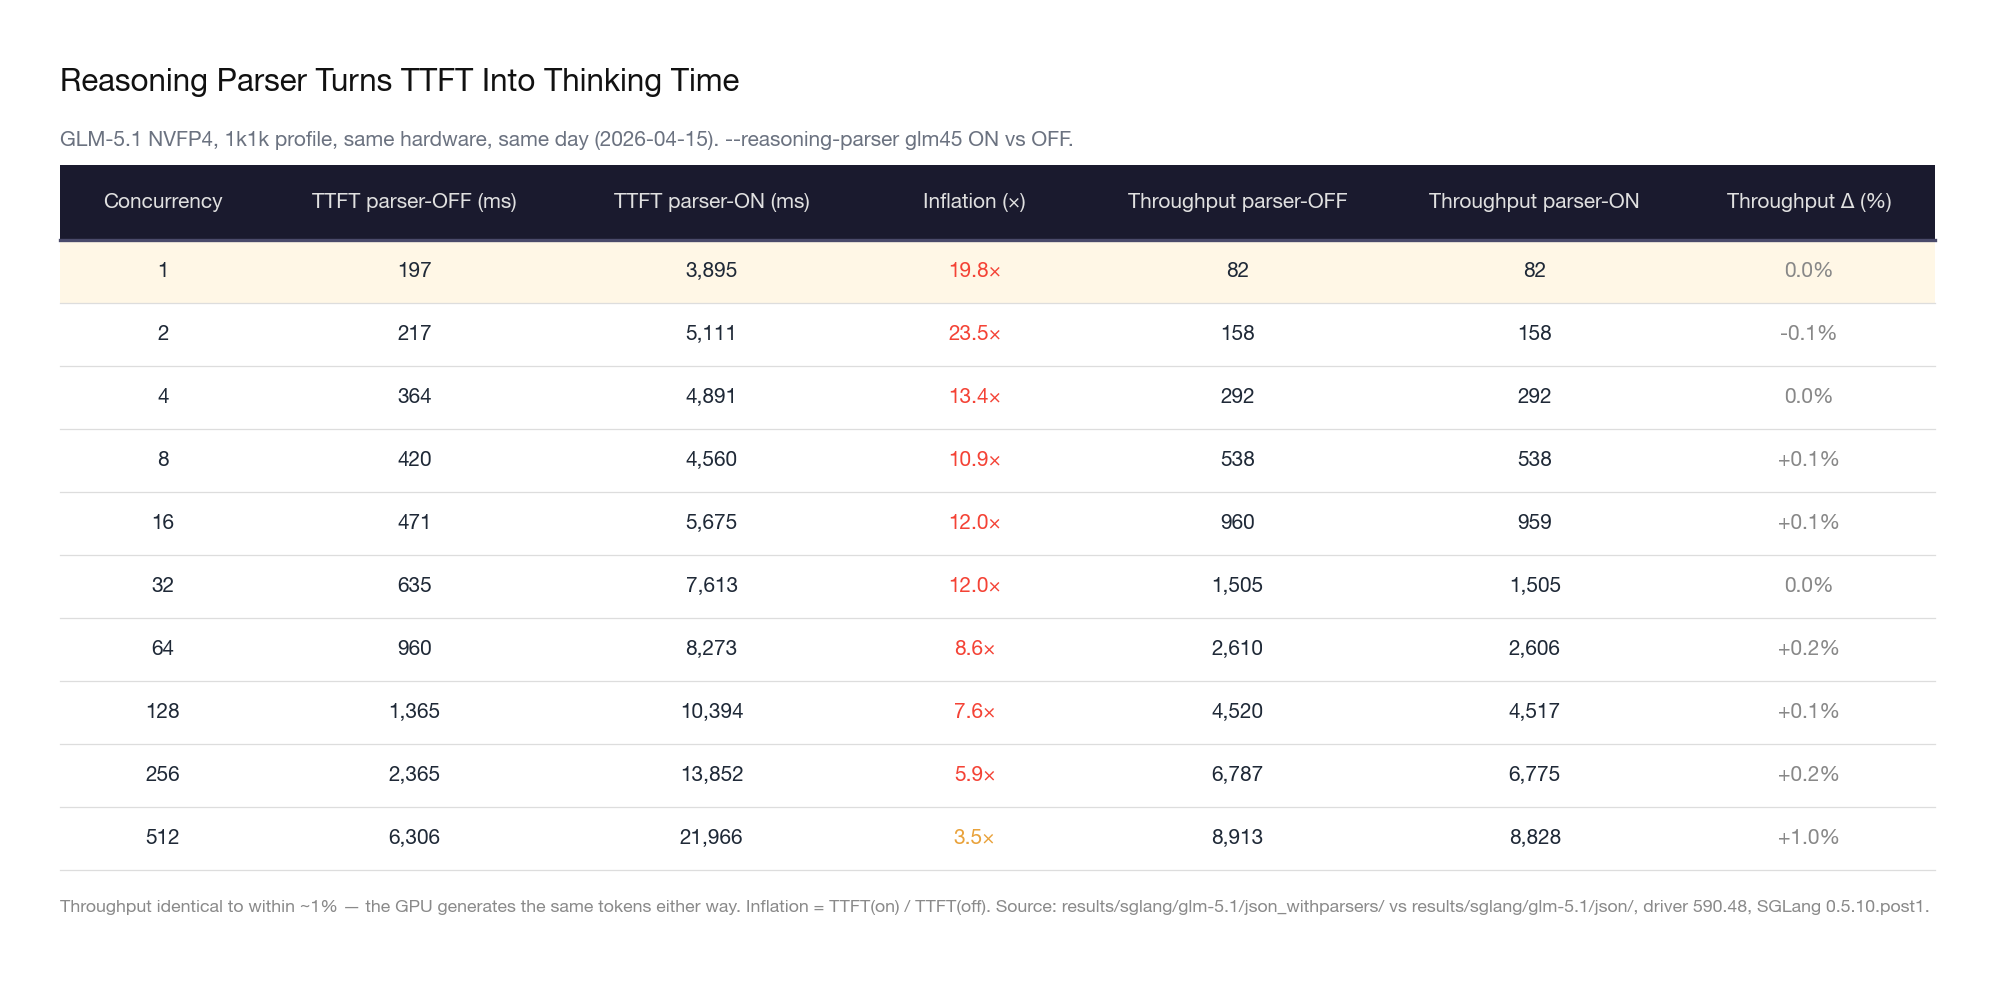
The TTFT Number You’re Reading Is Probably Wrong
Every frontier open-source model now ships with a reasoning mode. DeepSeek R1 generates <think> tokens. Qwen 3.5 does it. GLM-5.1 does it. When you deploy these models with a serving framework like SGLang or vLLM, you typically enable a reasoning parser — a flag that intercepts the thinking tokens and hides them from the user, only surfacing the final answer.
The problem: TTFT measures time from request arrival to the first visible token. The thinking tokens come first, but the parser swallows them. So the clock keeps running while the model thinks.
Here’s what actually happens on the wire:
t=0ms       Request arrives at server
t=15ms      GPU generates first token: "<think>"
t=15-800ms  GPU generates 50-200 thinking tokens
t=800ms     GPU generates "</think>"
t=810ms     GPU generates first visible token: "The answer is..."
            ← TTFT is measured HERE: 810ms
Without the parser, TTFT would report 15ms — the GPU started generating immediately. With the parser, TTFT reports 810ms. The system isn’t slow. The model is thinking. But the benchmark number doesn’t distinguish between the two.
We observed this across our benchmark runs. Models served with reasoning parsers consistently showed TTFT values that were anomalously high relative to their TPOT — sometimes by an order of magnitude. A model generating tokens at 7ms TPOT but reporting 400ms+ TTFT isn’t prefilling slowly. It’s thinking before it speaks.
The implication for the industry is uncomfortable: a significant number of published TTFT benchmarks are not measuring what people think they’re measuring. When a benchmark report shows “TTFT: 450ms” for DeepSeek R1, that number likely includes hundreds of milliseconds of reasoning token generation — not network latency, not prefill computation, not queue wait time. Just the model thinking silently before it answers.
This makes cross-model TTFT comparisons unreliable unless you know the parser configuration. A model with reasoning mode reporting 500ms TTFT might actually have faster system latency than a model without reasoning mode reporting 200ms TTFT — you can’t tell from the number alone.
For production deployments, there’s a real UX tradeoff here. Reasoning mode produces measurably better output quality — that’s why every frontier model now includes it. But it adds perceived latency before the user sees anything. Some frameworks solve this by streaming thinking tokens to the client in a separate reasoning_content field, letting the frontend display a “thinking...” animation. The user experience improves. The benchmark number doesn’t.
Our recommendation: always disclose whether a reasoning parser was active when reporting TTFT. Treat parser-on and parser-off TTFT as fundamentally different metrics. They measure different things, and conflating them produces misleading comparisons.
Benchmarking new hardware is never as clean as the results table suggests. Several issues consumed significant engineering time and may affect other teams deploying B300 nodes.
Expert Parallelism + NVFP4: Not Production-Ready
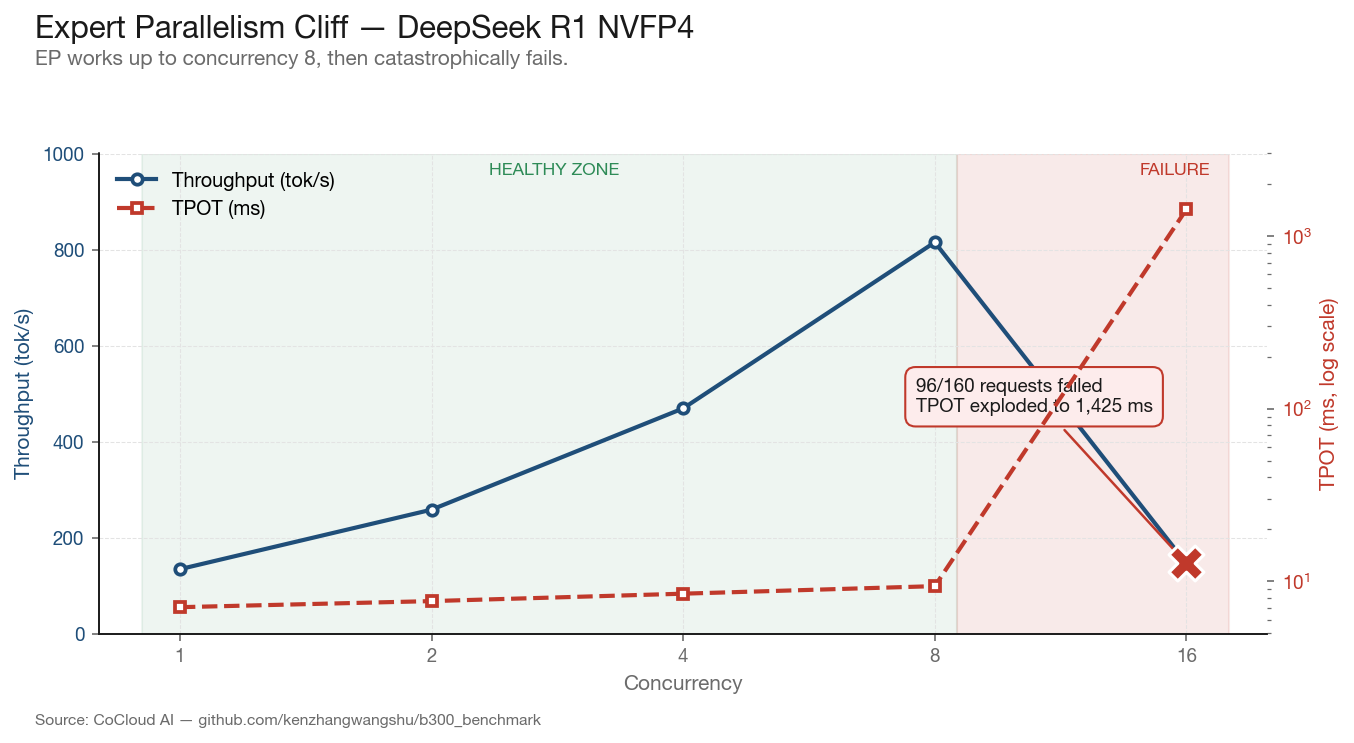
We initially attempted Expert Parallelism (EP) combined with NVFP4 quantization, as NVIDIA’s documentation suggests this combination for MoE models. On DeepSeek R1 with EP enabled, performance scaled cleanly from concurrency 1 through 8:
ConcurrencyThroughput (tok/s)TPOT (ms)Failed11347.1044698.5088159.40161461,42596
At concurrency 16, the system collapsed: 96 of 160 requests returned Internal Server Error, TPOT exploded to 1,425 ms, and effective throughput dropped below concurrency-1 levels. The EP communication overhead — which uses 20 SMs per GPU for inter-expert routing via DeepEP — becomes the dominant bottleneck as batch size increases.
We switched to TP=8 without EP for all subsequent benchmarks. The throughput at concurrency 8 under EP (815 tok/s) was dwarfed by the 12,518 tok/s achieved at optimal concurrency under pure TP. EP is not ready for single-node production deployments on B300 at current software maturity.
NGC Container Version Compatibility
B300 SXM6 with SM 103a (sm_103a) is not yet universally supported across NVIDIA’s container ecosystem. Our experience:
NGC 26.03 (vLLM 0.17.1): Functions at low concurrency but crashes at concurrency 16+ under driver 590. CUDA forward compatibility mode is unstable under sustained load.
NGC 26.01 (vLLM 0.13.0): Stable under all tested concurrency levels with driver 590, but lacks DeepGEMM and has no B300-specific MoE tuning config.
Bare-metal pip install (vLLM 0.19.0): CUTLASS
cutlass_scaled_mmkernel crashes immediately — pre-built binaries are not compiled for SM103.
The lesson: on B300, always use Docker containers, never bare-metal pip installs. And container version must match driver version precisely — the “latest” tag is not your friend.
All raw benchmark data, scripts, and configs are available at: github.com/BlacktraderKhan/b300_benchmark
Methodology
Hardware: 1× B300 NVL8 node, 8× NVIDIA B300 SXM6 AC, 288 GB HBM3e, air-cooled
Driver: 595.58.03, CUDA 13.2 (590.48.01 for driver comparison section)
Framework: SGLang (latest-cu130-runtime Docker image)
Precision: NVFP4 via NVIDIA Model Optimizer (
--quantization modelopt_fp4)Parallelism: TP=8, no EP, no PP
Benchmark tool: SGLang bench serve, random synthetic data
Profiles: 1k1k (ISL=1024, OSL=1024), 1k4k (ISL=1024, OSL=4096), 4k1k (ISL=4096, OSL=1024)
Concurrency: Swept 1, 2, 4, 8, 16, 32, 64, 128, 256; stopped at failures or plateau
Warmup: All servers warmed with a single request before benchmarking; first benchmark run discarded
Peak throughput: Reported as maximum output throughput across all concurrency levels per profile